

Read and download the CBSE Class 10 Mathematics Statistics Assignment Set 01 for the 2026-27 academic session. We have provided comprehensive Class 10 Mathematics school assignments that have important solved questions and answers for Chapter 13 Statistics. These resources have been carefuly prepared by expert teachers as per the latest NCERT, CBSE, and KVS syllabus guidelines.
Solved Assignment for Class 10 Mathematics Chapter 13 Statistics
Practicing these Class 10 Mathematics problems daily is must to improve your conceptual understanding and score better marks in school examinations. These printable assignments are a perfect assessment tool for Chapter 13 Statistics, covering both basic and advanced level questions to help you get more marks in exams.
Chapter 13 Statistics Class 10 Solved Questions and Answers
Question. Which of the following is a measure of central tendency?
(a) Frequency
(b) Cumulative frequency
(c) Mean
(d) Class-limit
Answer : C
Question. If the arithmetic mean of the following distribution is 47, then the value of p is
| Class interva | 0-20 | 20-40 | 40-60 | 60-80 | 80-100 |
| Frequency | 8 | 15 | 20 | p | 5 |
(a) 10
(b) 11
(c) 13
(d) 12
Answer : D
Question. The times (in seconds) taken by 150 atheletes to run a 110 m hurdle race are tabulated below
| Class | 13.8-14 | 14-14.2 | 14.2-14.4 | 14.4-14.6 | 14.6-14.8 | 14.8-15 |
| Frequency | 2 | 4 | 5 | 71 | 48 | 20 |
The number of atheletes who completed the race in less than 14.6 s is
(a) 11
(b) 71
(c) 82
(d) 130
Answer : C
Question. If the difference of mode and median of a data is 24, then the difference of median and mean is
(a) 12
(b) 24
(c) 8
(d) 36
Answer : A
Question. If xi ’s are the mid-points of the class intervals of grouped data, fi ’s are the corresponding frequencies and x is the mean, then Σ(fi xi − x) is equal to
(a) 0
(b) −1
(c) 1
(d) 2
Answer : A
Question. For the following distribution
| Marks | Number of students | Marks | Number of students |
| Below 10 Below 20 Below 30 | 3 12 28 | Below 40 Below 50 Below 60 | 57 75 80 |
The modal class is
(a) 0-20
(b) 20-30
(c) 30-40
(d) 50-60
Answer : C
Question. While computing mean of grouped data, we assume that the frequencies are
(a) evenly distributed over all the class
(b) centred at the class marks of the class
(c) centred at the upper limits of the class
(d) centred at the lower limits of the class
Answer : B
Question. While computing the mean of grouped data, we assume that the frequencies are
(a) evenly distributed over all the class
(b) centred at the class marks of the class
(c) centred at the upper limits of the class
(d) centred at the lower limits of the class
Answer : B
Question. A student noted the number of cars passing through a spot on a road for 100 periods each of 3 min and summarised in the table given below.
| Numbe of cars | Frequency |
| 0-10 10-20 20-30 30-40 40-50 50-60 60-70 70-80 | 7 14 13 12 20 11 15 8 |
Then, the mode of the data is
(a) 34.7
(b) 44.7
(c) 54.7
(d) 64.7
Answer : B
Question. For the following distribution
| Marks | Number of students |
| Below 10 Below 20 Below 30 Below 40 Below 50 Below 60 | 3 |
The modal class is
(a) 10-20
(b) 20-30
(c) 30-40
(d) 50-60
Answer : C
Question. Consider the following distribution
| Marks obtained | Number of students |
More than or equal to 0 | 63 58 55 51 48 42 |
The frequency of the class 30-40 is
(a) 3
(b) 4
(c) 48
(d) 51
Answer : A
Question. The mean, mode and median of grouped data will always be
(a) same
(b) different
(c) depends on the type of data
(d) None of the above
Answer : C
Question. Consider the following frequency distribution
| Class | 0-5 | 6-11 | 12-17 | 18-23 | 24-29 |
| Frequency | 13 | 10 | 15 | 6 | 11 |
The upper limit of the median class is
(a) 17
(b) 17.5
(c) 18
(d) 18.5
Answer : B
Question. Mode of the following grouped frequency distribution is
| Class | 3-6 | 6-9 | 6-9 9-12 | 12-15 | 15-18 | 18-21 | 21-24 |
| Frequency | 2 | 5 | 10 | 23 | 21 | 12 | 3 |
(a) 13.6
(b) 15.6
(c) 14.6
(d) 16.6
Answer : C
Question. If the number of runs scored by 11 players of a cricket team of India are 5, 19, 42, 11, 50, 30, 21, 0, 52, 36, 27, then median is
(a) 30
(b) 32
(c) 36
(d) 27
Answer : D
Question. Consider the following frequency distribution
| Class | 65- 85 | 85- 105 | 105- 125 | 125- 145 | 145- 165 | 165- 185 | 185- 205 |
| Frequency | 4 | 5 | 13 | 20 | 14 | 7 | 4 |
The difference of the upper limit of the median class and the lower limit of the modal class is
(a) 0
(b) 19
(c) 20
(d) 38
Answer : C
Question. The mean and median of a distribution are 14 and 15 respectively. The value of mode is
(a) 16
(b) 17
(c) 13
(d) 18
Answer : B
Case Based Study
A. Analysis of Water Consumption in a Society An inspector in an enforcement squad of department of water resources visit to a society of 100 families and record their monthly consumption of water on the basis of family members and wastage of water, which is summarise in the following table.
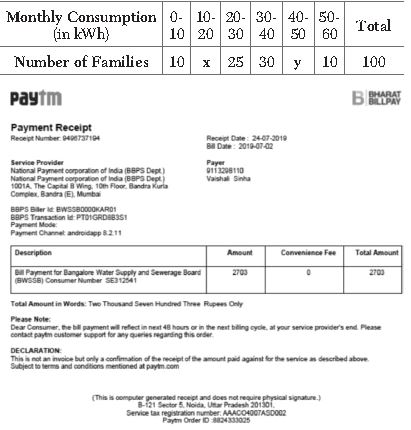
Based on the above information, answer the following questions.
Question. The value of x + y is
(a) 50
(b) 42
(c) 25
(d) 200
Answer : C
Question. If the median of the above data is 32, then x is equal to
(a) 10
(b) 8
(c) 9
(d) None of these
Answer : C
Question. What will be the upper limit of the modal class?
(a) 40
(b) 60
(c) 65
(d) 70
Answer : A
Question. If A be the assumed mean, then A is always
(a) > (Actual mean)
(b) < (Actual Mean)
(c) = (Actual Mean)
(d) Can’t say
Answer : D
Question. The class mark of the modal class is
(a) 25
(b) 35
(c) 30
(d) 45
Answer : B
B. As the demand for the products grew a manufacturing company decided to purchase more machines. For which they want to know the mean time required to complete the work for a worker.
The following table shows the frequency distribution of the time required for each machine to complete a work.
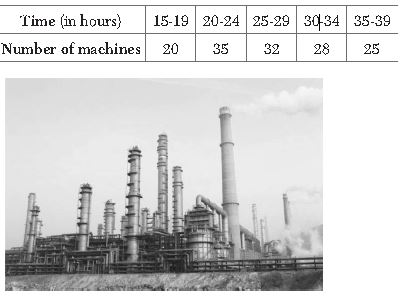
Based on the above information, answer the following questions.
Question. The class mark of the modal class 30-34 is
(a) 17
(b) 22
(c) 27
(d) 32
Answer : D
Question. If xi ’s denotes the class mark and fi ’s denotes the corresponding frequencies for the given data, then the value of Σxi fi equals to
(a) 3600
(b) 3205
(c) 3670
(d) 3795
Answer : D
Question. The mean time required to complete the work for a worker is
(a) 27.10 h
(b) 23 h
(c) 24 h
(d) None of the above
Answer : A
Question. If a machine work for 10 h in a day, then approximate time required to complete the work for a machine is
(a) 3 days
(b) 4 days
(c) 5 days
(d) 6 days
Answer : A
Question. The measure of central tendency is
(a) Mean
(b) Median
(c) Mode
(d) All of these
Answer : D
C. Direct income in India was drastically impacted due to the COVID-19 lockdown. Most of the companies decided to bring down the salaries of the employees upto 50%.
The following table shows the salaries (in percent) received by 50 employees during lockdown.
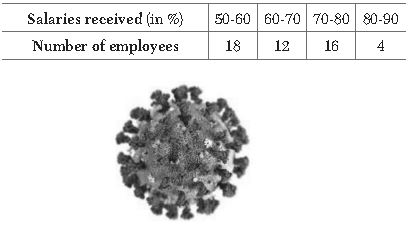
Based on the above information, answer the following questions.
Question. Total number of persons whose salary is reduced by more than 20% is
(a) 40
(b) 46
(c) 30
(d) 22
Answer : B
Question. Total number of persons whose salary is reduced by atmost 40% is
(a) 32
(b) 40
(c) 46
(d) 18
Answer : A
Question. The modal class is
(a) 50-60
(b) 60-70
(c) 70-80
(d) 80-90
Answer : A
Question. The median class of the given data is
(a) 50-60
(b) 60-70
(c) 70-80
(d) 80-90
Answer : B
Question. The empirical relationship among mean, median and mode is
(a) 3 Median = Mode +2 Mean
(b) 3 Median = Mode −2 Mean
(c) Median = 3Mode −2 Mean
(d) Median =3Mode +2 Mean
Answer : A
LEVEL 1 (1 Mark)
Question. Find the class mark of the class 10 – 25
Answer: \(\frac{10+25}{2} = \frac{35}{2} = 17.5\)
Question. Find the mean of first five natural numbers.
Answer: \(\frac{1+2+3+4+5}{5} = \frac{15}{5} = 3\)
Question. If the mode of the distribution is 8 & mean is also 8 then find median
Answer:
3 median = mode + 2 mean
3 median = \(8 + 2 \times 8 = 24\)
Median = \(\frac{24}{3} = 8\).
Question. Find the modal class of the following distribution
| Class | 0-6 | 6-12 | 12-18 | 18-24 | 24-30 |
|---|---|---|---|---|---|
| frequency | 7 | 5 | 10 | 12 | 6 |
Answer: Maximum frequency = 12
Modal class is 18-24.
LEVEL 2 (2 Marks)
Question. Convert the following frequency distribution table into a less than type cumulative frequency distribution table:
| Marks | 0 – 5 | 5 – 10 | 10 – 15 | 15 – 20 | 20 – 25 | 25 – 30 |
|---|---|---|---|---|---|---|
| No. of students. | 4 | 7 | 12 | 18 | 6 | 3 |
Answer: Less than type cumulative frequency table is:
| Marks | f | c.f. |
|---|---|---|
| Less than 5 | 4 | 4 |
| Less than 10 | 7 | 11 |
| Less than 15 | 12 | 23 |
| Less than 20 | 18 | 41 |
| Less than 25 | 6 | 47 |
| Less than 30 | 3 | 50 |
Question. Find the mean of the following data
| \(X_1\) | 10 | 15 | 20 | 25 | 30 |
|---|---|---|---|---|---|
| \(F_1\) | 5 | 10 | 7 | 8 | 2 |
Answer:
| \(x_1\) | \(f_i\) | \(f_i x_i\) |
|---|---|---|
| 10 | 5 | 50 |
| 15 | 10 | 150 |
| 20 | 7 | 140 |
| 25 | 8 | 200 |
| 30 | 2 | 60 |
| Total | \(\sum f_i = 32\) | \(\sum f_i x_i = 600\) |
Mean = \(\frac{\sum f_i x_i}{\sum f_i} = \frac{600}{32} = 18.75\)
Question. If mean of the following data is 9, Find the value of K.
| x | 3 | 6 | 12 | 15 | 9 |
|---|---|---|---|---|---|
| y | 4 | K | 1 | 6 | 4 |
Answer:
| x | y | xy |
|---|---|---|
| 3 | 4 | 12 |
| 6 | K | 6k |
| 12 | 1 | 12 |
| 15 | 6 | 90 |
| 9 | 4 | 36 |
| Total | \(15 + K\) | \(150 + 6K\) |
\[ \bar{x} = \frac{\sum f_i x_i}{\sum f_i} \]
\[ \Rightarrow 9 = \frac{150 + 6K}{15 + K} \]
\[ \Rightarrow 135 + 9K = 150 + 6K \]
\[ \Rightarrow 3K = 15 \Rightarrow K = 5 \]
Question. Write a frequency distribution table for the following data:
| Marks | Above 0 | Above 10 | Above 20 | Above 30 | Above 40 | Above 50 |
|---|---|---|---|---|---|---|
| No. of students | 30 | 28 | 21 | 15 | 10 | 0 |
Answer:
| Marks | No. of students |
|---|---|
| 0 - 10 | 2 |
| 10 - 20 | 7 |
| 20 - 30 | 6 |
| 30 - 40 | 5 |
| 40 - 50 | 10 |
| Total | 30 |
LEVEL 3 (3 Marks)
Question. The distribution below gives the weights of 30 students of a class. Find the median weight of the students
| Weight in Kg | 40-45 | 45-50 | 50-55 | 55-60 | 60-65 | 65-70 | 70-75 |
|---|---|---|---|---|---|---|---|
| No. of students | 2 | 3 | 8 | 6 | 6 | 3 | 2 |
Answer:
| Marks | Frequency | C.F |
|---|---|---|
| 40 – 45 | 2 | 2 |
| 45 – 50 | 3 | 3+2 = 5 |
| 50 – 55 | 8 | 5+8 = 13 |
| 55 – 60 | 6 | 13+6 = 19 |
| 60 – 65 | 6 | 19+6 = 25 |
| 65 – 70 | 3 | 25+3 = 28 |
| 70 – 75 | 2 | 28+2 = 30 |
\(N=30\), \(\frac{N}{2}=15\), \(l = 30\), \(f = 3\), \(h = 5\)
\[ \text{Median} = l + \left[ \frac{\frac{n}{2} - cf}{f} \right] \times h \]
\(= 50 + \frac{15-3}{8} \times 5\)
\(= 50 + \frac{12}{8} \times 5\)
\(= 50 + \frac{15}{2} = \frac{115}{2}\)
Question. Find the mode of the given data
| Family size | 1-3 | 3-5 | 5-7 | 7-9 | 9-11 |
|---|---|---|---|---|---|
| no. of families | 7 | 8 | 2 | 2 | 1 |
Answer: Model class = 3-5, \(l = 3\), \(h = 2\)
\(f_1 = 8\), \(f_0 = 7\), \(f_2 = 2\)
\[ \text{Mode} = l + \frac{(f_1 - f_0) \times h}{2 f_1 - f_0 - f_2} \]
Solving mode = 3.286
Question. Find x if mean of the following data is 62.8.
| Class interval | Frequency |
|---|---|
| 0-20 | 5 |
| 20-40 | 8 |
| 40-60 | x |
| 60-80 | 12 |
| 80-100 | 7 |
| 100-120 | 8 |
Answer:
| C.I. | \(x_i\) | \(f_i\) | \(f_i \times x_i\) |
|---|---|---|---|
| 0 -20 | 10 | 5 | 50 |
| 20-40 | 30 | 8 | 240 |
| 40-60 | 50 | x | 50x |
| 60-80 | 70 | 12 | 840 |
| 80-100 | 90 | 7 | 630 |
| 100-120 | 110 | 8 | 880 |
| Total | \(\sum f_i = 40 + x\) | \(\sum f_i x_i = 2640 + 50x\) |
\[ \bar{x} = \frac{\sum f_i x_i}{\sum f_i} \]
\(62.8 = \frac{2640 + 50x}{40+x}\)
\(62.8(40+x) = 2640 + 50x\)
\(2512+62.8x = 2640 + 50x\)
\(62.8x – 50x = 2640 – 2512\)
\(12.8x = 128\)
\(x = \frac{128}{12.8} = \frac{1280}{128}\)
\(x = 10\).
Question. If the mean of the following distribution is 6 , find the value of p
| X | 2 | 4 | 6 | 10 | P+5 |
|---|---|---|---|---|---|
| f | 3 | 2 | 3 | 1 | 2 |
Answer:
| x | f | fx |
|---|---|---|
| 2 | 3 | 6 |
| 4 | 2 | 8 |
| 6 | 3 | 18 |
| 10 | 1 | 10 |
| P+5 | 2 | \(2p+10\) |
| Total | 11 | \(52+2p\) |
\[ \frac{\sum fx}{\sum f} = \text{mean} \]
So \(\text{mean} = \frac{52+2p}{11} = 6\)
\(2p = 66 - 52\)
\(p = 7\)
LEVEL 4 (4 Marks)
Question. The median of the following data is 35 and the sum of all the frequencies is 170. Find \(f_1\) and \(f_2\), the missing frequencies.
| Class Interval | Frequencies |
|---|---|
| 0-10 | 10 |
| 10-20 | 20 |
| 20-30 | \(f_1\) |
| 30-40 | 40 |
| 40-50 | \(f_2\) |
| 50-60 | 25 |
| 60-70 | 15 |
Answer:
\(f_1+f_2+110=170 \Rightarrow f_1+f_2 = 170 - 110 = 60\)
Finding cumulative frequencies (c.f.):
| Class Interval | Frequency | Cumulative Frequency (c.f.) |
|---|---|---|
| 0-10 | 10 | 10 |
| 10-20 | 20 | 30 |
| 20-30 | \(f_1\) | \(30+f_1\) |
| 30-40 | 40 | \(70+f_1\) |
| 40-50 | \(f_2\) | \(70+f_1+f_2\) |
| 50-60 | 25 | \(95+f_1+f_2\) |
| 60-70 | 15 | \(110+f_1+f_2\) |
Median class = 30-40
\(l = 30\), \(n = 170\), \(cf = 30+f_1\), \(h = 10\), \(f = 40\)
\[ \text{Median} = l + \left[ \frac{\frac{n}{2} - cf}{f} \right] \times h \]
\(35 = 30 + \left[ \frac{170}{2} - (30+f_1) \right] \times \frac{10}{40}\)
\(35-30 = \frac{85 - (30+f_1)}{4}\)
\(5 \times 4 = 85 - 30 - f_1\)
\(20 - 85 + 30 = -f_1\)
\(f_1 = 35\)
Therefore, \(f_2 = 60 - 35 = 25\)
Question. The median of the following data is 525. Find the values of x and y, if the Total frequency is 100.
| Class interval | Frequency |
|---|---|
| 0-100 | 2 |
| 100-200 | 5 |
| 200-300 | X |
| 300-400 | 12 |
| 400-500 | 17 |
| 500-600 | 20 |
| 600-700 | Y |
| 700-800 | 9 |
| 800-900 | 7 |
| 900-1000 | 4 |
Answer:
| Class interval | Frequency | Cumulative frequency |
|---|---|---|
| 0-100 | 2 | 2 |
| 100-200 | 5 | 7 |
| 200-300 | X | \(7+x\) |
| 300-400 | 12 | \(19+x\) |
| 400-500 | 17 | \(36+x\) |
| 500-600 | 20 | \(56+x\) |
| 600-700 | Y | \(56+x+y\) |
| 700-800 | 9 | \(65+x+y\) |
| 800-900 | 7 | \(72+x+y\) |
| 900-1000 | 4 | \(76+x+y\) |
It is given that \(n = 100\)
So, \(76 + x + y = 100\), i.e., \(x + y = 24\) -- (1)
The median is 525, which lies in the class 500 – 600
So, \(l = 500\), \(f = 20\), \(cf = 36 + x\), \(h = 100\)
Using the formula:
\[ \text{Median} = l + \left[ \frac{\frac{n}{2} - cf}{f} \right] \times h \]
We get:
\(525 = 500 + \left[ \frac{50 - (36+x)}{20} \right] \times 100\)
\(525 - 500 = (14 - x) \times 5\)
\(25 = 70 - 5x\)
\(5x = 70 - 25 = 45\)
So, \(x = 9\)
Therefore, from (1), we get:
\(9 + y = 24 \Rightarrow y = 15\)
Hence, \(x = 9\) and \(y = 15\).
Question. The mean of the following frequency table is 50. Find the missing frequencies.
| Class | 0-20 | 20-40 | 40-60 | 60-80 | 80-100 | Total |
|---|---|---|---|---|---|---|
| Frequency | 17 | \(F_1\) | 32 | \(F_2\) | 19 | 120 |
Answer:
| Class | \(f_i\) | \(X_i\) | \(u_i = \frac{x_i-a}{h}\) | \(f_i u_i\) |
|---|---|---|---|---|
| 0-20 | 17 | 10 | \(\frac{10-50}{20} = -2\) | -34 |
| 20-40 | \(F_1\) | 30 | \(\frac{30-50}{20} = -1\) | \(-F_1\) |
| 40-60 | 32 | 50 | 0 | 0 |
| 60-80 | \(F_2\) | 70 | \(\frac{70-50}{20} = 1\) | \(F_2\) |
| 80-100 | 19 | 90 | \(\frac{90-50}{20} = 2\) | 38 |
| Total | 120 | \(4 - F_1 + F_2\) |
From the total frequency:
\(17 + F_1 + 32 + F_2 + 19 = 120\)
\(\Rightarrow F_1 + F_2 = 120 - 68\)
\(\Rightarrow F_1 + F_2 = 52\) -- (1)
Using the step-deviation formula for Mean (with assumed mean \(a = 50\) and \(h = 20\)):
\[ \text{Mean} = a + h \left[ \frac{\sum f_i u_i}{\sum f_i} \right] \]
\(50 = 50 + 20 \left[ \frac{4 - F_1 + F_2}{120} \right]\)
\(\Rightarrow 0 = 20 \left[ \frac{4 - F_1 + F_2}{120} \right]\)
\(\Rightarrow 4 - F_1 + F_2 = 0\)
\(\Rightarrow F_1 - F_2 = 4\) -- (2)
Solving equations (1) and (2):
Adding (1) and (2) gives:
\(2F_1 = 56 \Rightarrow F_1 = 28\)
Substituting in (1):
\(28 + F_2 = 52 \Rightarrow F_2 = 24\).
Question. The following distribution gives the daily income of 50 workers of a factory. Convert the above data into a less than type Cumulative frequency distribution and draw its ogive.
| Daily income (in Rs.) | 100-120 | 120-140 | 140-160 | 160-180 | 180-200 |
|---|---|---|---|---|---|
| Number of workers | 12 | 14 | 8 | 6 | 10 |
Answer:
| Daily income (in Rs.) | Number of workers (\(f_i\)) | Cumulative frequency less than type |
|---|---|---|
| Less than 120 | 12 | 12 |
| Less than 140 | 14 | 12+14 = 26 |
| Less than 160 | 8 | 26+8 = 34 |
| Less than 180 | 6 | 34+6 = 40 |
| Less than 200 | 10 | 40+10 = 50 |
| Total | \(\sum f_i = 50\) |
By plotting the points on the graph:
i.e., \((120,12)\); \((140,26)\); \((160,34)\); \((180,40)\); \((200,50)\).
We obtain the graph of the less than type cumulative frequency curve (Ogive).
Free study material for Mathematics
CBSE Class 10 Mathematics Chapter 13 Statistics Assignment
Access the latest Chapter 13 Statistics assignments designed as per the current CBSE syllabus for Class 10. We have included all question types, including MCQs, short answer questions, and long-form problems relating to Chapter 13 Statistics. You can easily download these assignments in PDF format for free. Our expert teachers have carefully looked at previous year exam patterns and have made sure that these questions help you prepare properly for your upcoming school tests.
Benefits of solving Assignments for Chapter 13 Statistics
Practicing these Class 10 Mathematics assignments has many advantages for you:
- Better Exam Scores: Regular practice will help you to understand Chapter 13 Statistics properly and you will be able to answer exam questions correctly.
- Latest Exam Pattern: All questions are aligned as per the latest CBSE sample papers and marking schemes.
- Huge Variety of Questions: These Chapter 13 Statistics sets include Case Studies, objective questions, and various descriptive problems with answers.
- Time Management: Solving these Chapter 13 Statistics test papers daily will improve your speed and accuracy.
How to solve Mathematics Chapter 13 Statistics Assignments effectively?
- Read the Chapter First: Start with the NCERT book for Class 10 Mathematics before attempting the assignment.
- Self-Assessment: Try solving the Chapter 13 Statistics questions by yourself and then check the solutions provided by us.
- Use Supporting Material: Refer to our Revision Notes and Class 10 worksheets if you get stuck on any topic.
- Track Mistakes: Maintain a notebook for tricky concepts and revise them using our online MCQ tests.
Best Practices for Class 10 Mathematics Preparation
For the best results, solve one assignment for Chapter 13 Statistics on daily basis. Using a timer while practicing will further improve your problem-solving skills and prepare you for the actual CBSE exam.
FAQs
You can download free PDF assignments for Class 10 Mathematics Chapter 13 Statistics from StudiesToday.com. These practice sheets have been updated for the 2026-27 session covering all concepts from latest NCERT textbook.
Yes, our teachers have given solutions for all questions in the Class 10 Mathematics Chapter 13 Statistics assignments. This will help you to understand step-by-step methodology to get full marks in school tests and exams.
Yes. These assignments are designed as per the latest CBSE syllabus for 2026. We have included huge variety of question formats such as MCQs, Case-study based questions and important diagram-based problems found in Chapter 13 Statistics.
Practicing topicw wise assignments will help Class 10 students understand every sub-topic of Chapter 13 Statistics. Daily practice will improve speed, accuracy and answering competency-based questions.
Yes, all printable assignments for Class 10 Mathematics Chapter 13 Statistics are available for free download in mobile-friendly PDF format.