

Read and download the CBSE Class 3 Maths Data Handling Question Bank in PDF format. We have provided exhaustive and printable Class 3 Mathematics worksheets for Data Handling, designed by expert teachers. These resources align with the 2026-27 syllabus and examination patterns issued by NCERT, CBSE, and KVS, helping students master all important chapter topics.
Chapter-wise Worksheet for Class 3 Mathematics Data Handling
Students of Class 3 should use this Mathematics practice paper to check their understanding of Data Handling as it includes essential problems and detailed solutions. Regular self-testing with these will help you achieve higher marks in your school tests and final examinations.
Class 3 Mathematics Data Handling Worksheet with Answers
Direction (Qs. 1 to 5): There was an inter school chess competition and many students participated in the competition. The organization committee decided to record the number of prizes won by each school.
They used the picture

to show two prizes won by school and recorded the data as given below:
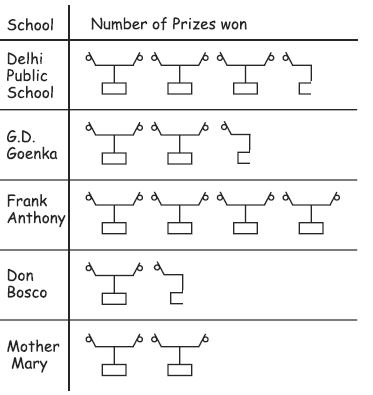
1. Which school won the maximum prizes ?
(a) Mother Mary
(b) Delhi Public School
(c) Frank Anthony
(d) G. D. Goenka
Answer : C
2. How many prizes did Don Bosco School win ?
(a) 4
(b) 3
(c) 2
(d) 5
Answer : B
3. How many less prizes did Mother Mary school win than G. D. Goenka School ?
(a) 1
(b) 2
(c) 3
(d) 4
Answer : C
4. How many more prizes did Delhi Public School win than Don Bosco School ? (Tricky)
(a) 1
(b) 2
(c) 3
(d) 4
Answer : D
5. Which school won 5 prizes ?
(a) Mother Mary
(b) G. D. Goenka
(c) Delhi Public School
(d) Don Bosco
Answer : B
Direction (Qs. 6 to 10): Bumpy made a table for number of buttons she pasted on a chart paper to make a design. She used different colour buttons for design. She accidently spilt water over the table and some of the entries got erased. Complete the data for her and also answer the questions that follow :
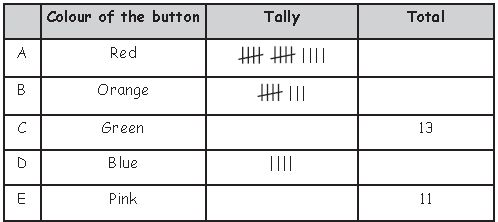
6. How many orange buttons were pasted ?
(a) 7
(b) 8
(c) 9
(d) 10
Answer : B
7. What will come in row C under tally marks ?
(a) |||| |||| ||
(b) |||| ||||
(c) |||| |||| |||
(d) |||| |||| ||||
Answer : C
8. How many more pink button were pasted than blue buttons?
(a) 7
(b) 6
(c) 5
(d) 4
Answer : A
9. Which buttons were pasted for maximum times on the chart paper ?
(a) Orange
(b) Green
(c) Red
(d) Pink
Answer : C
10. How many less orange buttons were pasted than green buttons ?
(a) 2
(b) 3
(c) 4
(d) 5
Answer : D
Direction (Qs. 11 and 12): Read the diagram given below and answer the questions that follow :
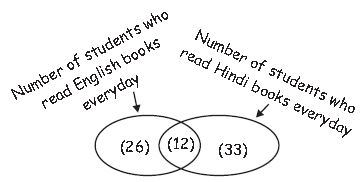
11. How many more students read Hindi books than English books everyday ?
(a) 6
(b) 7
(c) 8
(d) 9
Answer : B
12. How many students read both English and Hindi books everyday ?
(a) 7
(b) 26
(c) 12
(d) 33
Answer : C
Direction (Qs. 12 to 16): Read the diagram given below and answer the questions that follow:
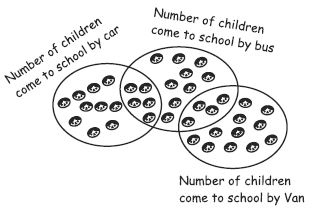
12. How many children come to school by bus only ?
(a) 10
(b) 9
(c) 8
(d) 7
Answer : B
13. How many children come to school by car only ?
(a) 10
(b) 9
(c) 8
(d) 7
Answer : A
14. How many children come to school by van only ?
(a) 9
(b) 10
(c) 11
(d) 12
Answer : C
15. How many children come to school by both car and bus ?
(a) 3
(b) 4
(c) 5
(d) 6
Answer : C
16. How many children come to school by both bus and van ?
(a) 3
(b) 4
(c) 5
(d) 6
Answer : B
Direction (Qs. 17 to 20: Poori Mausi wants to make a new recipie for her family. She wanted to know the favourite vegetable of most of the members of the family. So she made a list of vegetables and asked all the members in her family to put ‘ ✔ ’ if they like that vegetable and put ‘χ’ if they don’t like that vegetable. When all the members were finished with their votings the list appeared to be like the one given below. Read the chart given below and answer the questions that follow
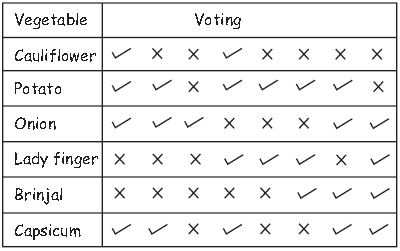
17. Poori Mausi wrote few statements after looking at the chart. One of the statement is wrong. Can you find it ?
A : Two members do not like potato. B : Four members like lady finger.
C : Five members like brinjal. D : Three members do not like onion.
(a) B
(b) A
(c) D
(d) C
Answer : D
18. After correcting her mistake she again wrote few sentence. This time she made more mistake. Read the sentence she made and write true / false for the sentence.
A : Highest number of people like potato.
B : Least number of people like cauliflower.
C : Lady finger is liked by more people than capsicum.
D : Brinjal is liked by more people than onion.
(a) TFFT
(b) TTFF
(c) FFTT
(d) FTTF
Answer : B
19. Poori Mausi got confused so she made a list of four vegetables which were liked by maximum members of the family but the accidently included a wrong vegetable. Find the odd one out.
(a) Onion
(b) Potato
(c) Cauliflower
(d) Capsicum
Answer : C
20. After making so many mistake she finally gave up. She want to make a list of vegetables starting from the vegetable which is most liked by her family to the vegetable which is not much liked by her family. Help Poori Mausi to arrange the vegetables in correct order.
A : Cauliflower B : Potato C : Onion
D : Lady finger E : Brinjal F : Capsicum
(a) C F B D A E
(b) B C F D E A
(c) A D C F B E
(d) B C F A E D
Answer : B
Direction (Qs. 21 and 23): Chamanlal watchman gets a duty of recording the number of cars which are parked at the parking at different times on one day. He made a bar chart to show his recordings as given below.
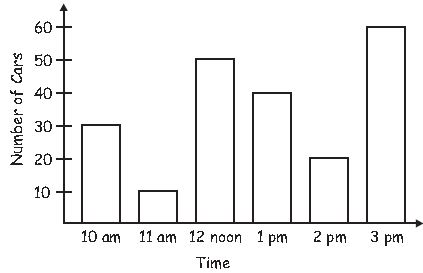
22. Read the bar chart and match the following :
| List I | List II |
| A. 60 cars | 1. 11 am |
| B. 10 cars | 2. 1 pm |
| C. 40 cars | 3. 3 pm |
| D. 30 cars | 4. 10 am |
A B C D
(a) 1 3 4 2
(b) 4 1 3 2
(c) 3 1 2 4
(d) 2 3 4 1
Answer : C
23. Read the bar chart given initially and complete the passage given below:
Chamanlal was given a duty to record the number of cars parked in the car parking at different times on one day. His duty started at 9 am and he saw there were no cars at that time. After 1 hour he saw ......... A ......... cars were parked in the car parking. Then at ......... B ......... 50 cars were parked in the car parking. He was recording the number of cars when some of the car owners drove off the cars and at ......... C ......... only 20 cars were left in the parking. He made a proper list for the number of cars parked at different times on that day. He was amazed to see that at ......... D ......... the parking was full. He kept the list and the bar chart in his file and finished his duty at 5 pm and went home.
A : (a) 10 (b) 20 (c) 30 (d) 40
B : (a) 11 am (b) 12 noon (c) 2 pm (d) 1 pm
C : (a) 1 pm (b) 2 pm (c) 3 pm (d) 12 noon
D : (a) 12 noon (b) 10 am (c) 3 pm (d) 1 pm
Answer : A. (c) Since 1 hour after 9 am is 10 am and at 10 am 30 cars were parked,
Therefore, the answer is option (c) 30.
B. (b) Since, 50 cars were parked at 12 noon.
Therefore, the answer is option (b) 12 noon.
C. (b) Since, 20 cars were parked at 2 pm.
Therefore, the answer is option (b) 2 pm.
D. (c) Since, the parking was full at 3 pm.
Therefore, the answer is option (c) 3 pm.
Page 158
Question Bank
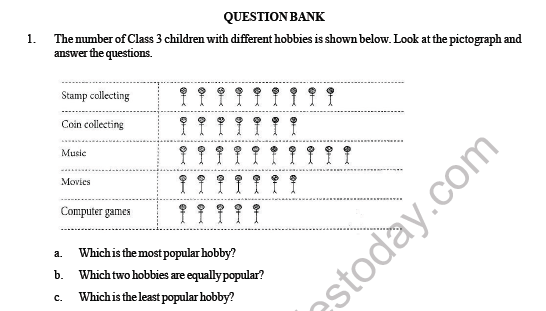
Question 1. The number of Class 3 children with different hobbies is shown below. Look at the pictograph and answer the questions.
| Hobby | Number of Children |
|---|---|
| Stamp collecting | 🧍 🧍 🧍 🧍 🧍 🧍 🧍 🧍 |
| Coin collecting | 🧍 🧍 🧍 🧍 🧍 🧍 |
| Music | 🧍 🧍 🧍 🧍 🧍 🧍 🧍 🧍 🧍 🧍 |
| Movies | 🧍 🧍 🧍 🧍 🧍 🧍 |
| Computer games | 🧍 🧍 🧍 🧍 |
a. Which is the most popular hobby?
b. Which two hobbies are equally popular?
c. Which is the least popular hobby?
Answer:
(a) Music is liked by the highest number of children. It has 10 figures.
(b) Coin collecting and movies are equally liked. They both have 6 figures.
(c) Computer games is the least liked hobby. It has only 4 figures.
In simple words: Music is the top favorite hobby. Coin collecting and movies have the same number of votes. Computer games is the least liked.
Exam Tip: To find which hobby is the most popular, count the number of pictures in each row and find the largest number.
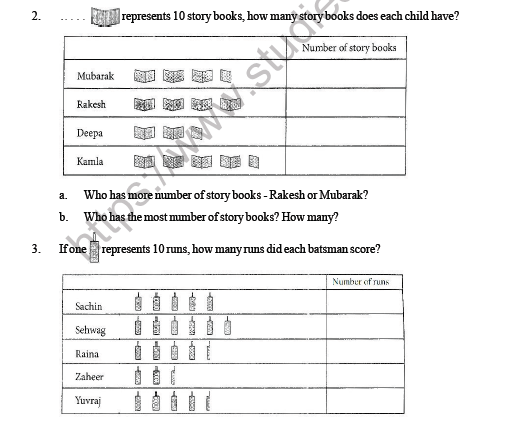
Question 2. If one represents 10 story books, how many story books does each child have?
| Child | Number of story books |
|---|---|
| Mubarak | 📖 📖 📖 📖 |
| Rakesh | 📖 📖 📖 📖 📖 |
| Deepa | 📖 📖 📖 |
| Kamla | 📖 📖 📖 📖 📖(half) |
a. Who has more number of story books - Rakesh or Mubarak?
b. Who has the most number of story books? How many?
Answer:
(a) Rakesh has more story books than Mubarak.
(b) Kamla has the most number of story books. She has 45 books in total.
In simple words: Rakesh has 50 books, and Mubarak has 40 books, so Rakesh has more. Kamla has the most with 45 books.
Exam Tip: Always multiply the number of pictures by the key value (10 books per picture) to find the correct total.
Page 159
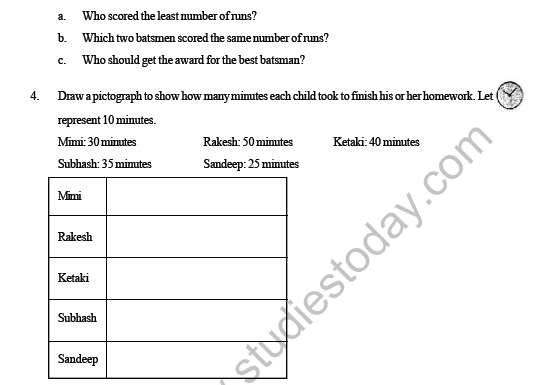
Question 3. If one represents 10 runs, how many runs did each batsman score?
| Batsman | Number of runs |
|---|---|
| Sachin | 🏏 🏏 🏏 🏏 🏏 |
| Sehwag | 🏏 🏏 🏏 🏏 🏏 🏏 |
| Raina | 🏏 🏏 🏏 🏏 |
| Zaheer | 🏏 🏏 🏏 |
| Yuvraj | 🏏 🏏 🏏 🏏 |
a. Who scored the least number of runs?
b. Which two batsmen scored the same number of runs?
c. Who should get the award for the best batsman?
Answer:
(a) Zaheer scored the least number of runs, with 30 runs.
(b) Raina and Yuvraj scored the same number of runs, with 40 runs each.
(c) Sehwag should get the award for the best batsman because he scored the most runs, with 60 runs.
In simple words: Zaheer has the lowest runs (30). Raina and Yuvraj are tied (40 each). Sehwag is the best because he has the most runs (60).
Exam Tip: Count the bat pictures and multiply them by 10 to find each person's score before answering.
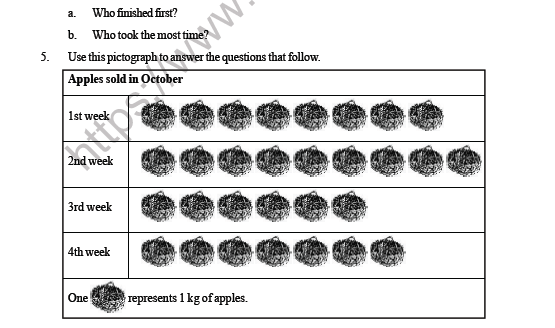
Question 4. Draw a pictograph to show how many minutes each child took to finish his or her homework. Let represent 10 minutes.
Mimi: 30 minutes
Rakesh: 50 minutes
Ketaki: 40 minutes
Subhash: 35 minutes
Sandeep: 25 minutes
a. Who finished first?
b. Who took the most time?
Answer: We can show this data in a pictograph. Let each clock icon 🕒 represent 10 minutes, and half a clock represent 5 minutes.
| Child | Time Taken |
|---|---|
| Mimi | 🕒 🕒 🕒 |
| Rakesh | 🕒 🕒 🕒 🕒 🕒 |
| Ketaki | 🕒 🕒 🕒 🕒 |
| Subhash | 🕒 🕒 🕒 🕒(half) |
| Sandeep | 🕒 🕒 🕒(half) |
(a) Sandeep finished his homework first because he took the least time (25 minutes).
(b) Rakesh took the most time to finish his homework (50 minutes).
In simple words: Sandeep finished first because he has the fewest clock pictures. Rakesh took the longest because he has the most clock pictures.
Exam Tip: The person who takes the least time is the one who finishes first.
Question 5. Use this pictograph to answer the questions that follow.
| Apples sold in October | |
|---|---|
| 1st week | 🍎 🍎 🍎 🍎 🍎 🍎 🍎 🍎 |
| 2nd week | 🍎 🍎 🍎 🍎 🍎 🍎 🍎 🍎 🍎 🍎 |
| 3rd week | 🍎 🍎 🍎 🍎 🍎 🍎 |
| 4th week | 🍎 🍎 🍎 🍎 🍎 🍎 |
One represents 1 kg of apples.
a. How many kg of apples were sold in the month of October?
b. In which week was the sale of apples maximum?
c. How many more kg of apples were sold in the 1st week than in the 3rd week?
Answer:
(a) A total of 30 kg of apples were sold in October (8 + 10 + 6 + 6 = 30 kg).
(b) The sale of apples was maximum in the 2nd week (10 kg).
(c) 2 kg more apples were sold in the 1st week than in the 3rd week (8 kg - 6 kg = 2 kg).
In simple words: Add all the apple pictures to get 30 kg in total. Week 2 has the most apples. Week 1 has 2 more apples than Week 3.
Exam Tip: Count each row carefully to find the weekly sales before performing addition and subtraction.
Page 160
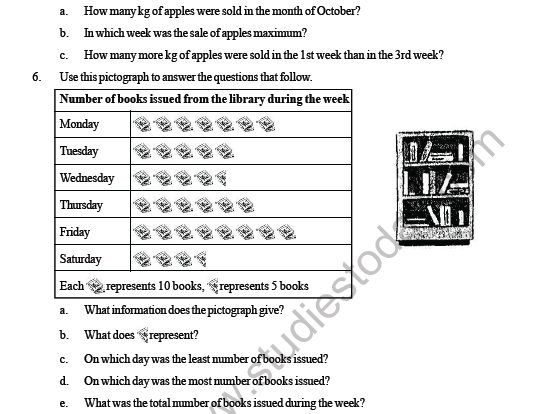
Question 6. Use this pictograph to answer the questions that follow.
| Number of books issued from the library during the week | |
|---|---|
| Monday | 📘 📘 📘 📘 📘 📘 |
| Tuesday | 📘 📘 📘 📘 📘 |
| Wednesday | 📘 📘 📘 📘 📖 |
| Thursday | 📘 📘 📘 📘 |
| Friday | 📘 📘 📘 📘 📘 📘 📘 📘 📘 |
| Saturday | 📘 📘 📘 📖 |
Each 📘 represents 10 books, 📖 represents 5 books
a. What information does the pictograph give?
b. What does 📖 represent?
c. On which day was the least number of books issued?
d. On which day was the most number of books issued?
e. What was the total number of books issued during the week?
Answer:
(a) The pictograph shows the number of books issued from the library during the week.
(b) The open book symbol 📖 represents 5 books.
(c) The least number of books was issued on Saturday (35 books).
(d) The most number of books was issued on Friday (90 books).
(e) The total number of books issued during the week is 340 (60 + 50 + 45 + 40 + 90 + 35 = 340 books).
In simple words: This chart tells us about library books. An open book means 5 books. Friday had the most books, and Saturday had the fewest. The total is 340 books.
Exam Tip: Be sure to count 📖 as 5 books and 📘 as 10 books when calculating your daily totals.
Question 7. The pictograph given below shows the languages taught in a school. Study it carefully and answer the following questions.
| The languages taught in a school | |
|---|---|
| French | 😊 😊 😊 😊 😊 |
| English | 😊 😊 😊 😊 😊 😊 😊 |
| Hindi | 😊 😊 😊 😊 😊 😊 😊 😊 |
| German | 😊 😊 😊 😊 |
| Japanese | 😊 😊 😊 |
Each stands for 50 students.
a. How many students learn Hindi?
b. How many more students learn French than Japanese?
Answer:
(a) There are 400 students who learn Hindi (8 smileys * 50 = 400).
(b) There are 100 more students who learn French than Japanese (250 students - 150 students = 100).
In simple words: Since each face is 50 children, Hindi has 400. French has 250 and Japanese has 150, so French has 100 more children.
Exam Tip: When calculating differences, subtract the number of symbols first and then multiply by the key value to find the answer quickly.
Page 161
Question 8. Using the data given below, draw a pictograph to show the favourite colours of children of class 3. (Read the key before drawing the pictograph.)
Red: 10 children, Purple: 8 children, Blue: 12 children
Green: 6 children, Yellow: 4 children, Orange: 14 children
a. What does the pictograph show?
b. Which colour is liked by the most number of children?
c. Which colour is liked by the least number of children?
Answer: Let each figure symbol 🧍 represent 2 children.
| Colour | Number of Children |
|---|---|
| Red | 🧍 🧍 🧍 🧍 🧍 |
| Green | 🧍 🧍 🧍 |
| Purple | 🧍 🧍 🧍 🧍 |
| Yellow | 🧍 🧍 |
| Blue | 🧍 🧍 🧍 🧍 🧍 🧍 |
| Orange | 🧍 🧍 🧍 🧍 🧍 🧍 🧍 |
Using our pictograph, we can answer the questions:
(a) The pictograph shows the favorite colors of Class 3 children.
(b) Orange is liked by the most number of children (14 children).
(c) Yellow is liked by the least number of children (4 children).
In simple words: This chart shows favorite colors. Orange has the most pictures, and yellow has the fewest.
Exam Tip: Double check that your drawn figures correctly match the division of values by 2 (e.g., 10 / 2 = 5 symbols for Red).
Question 9. Given below is data about the activities enjoyed by the students of class 3. Draw a pictograph using the data. (Read the key before drawing the pictograph.)
Outdoor games: 25 students, Computer games: 15 students
Dance: 30 students, Reading: 15 students, Gardening: 5 students
a. What is the title of the pictograph?
b. Which is the most popular activity?
c. Which activity is taken up by the least number of students?
Answer: Let each figure symbol 🧍 represent 5 children.
| Activity | Number of Students |
|---|---|
| Outdoor games | 🧍 🧍 🧍 🧍 🧍 |
| Computer games | 🧍 🧍 🧍 |
| Dance | 🧍 🧍 🧍 🧍 🧍 🧍 |
| Reading | 🧍 🧍 🧍 |
| Gardening | 🧍 |
Using our pictograph, we can answer the questions:
(a) The title of the pictograph is "Activities enjoyed by the students of class 3".
(b) Dance is the most popular activity (30 students).
(c) Gardening is the least popular activity (5 students).
In simple words: This chart shows class activities. Dance is the top favorite, and gardening is the least liked.
Exam Tip: Be sure to write the full title at the top of your pictograph table.
Page 162
Question 10. 24 children of class 3 named their favourite fruits as follows.
mango, banana, mango, apple, grapes, banana, apple, mango, grapes, mango, banana, apple, grapes, mango, apple, mango, grapes, mango, apple, banana, apple, mango, grapes, mango
Fill in the table using tally marks.
a. Which is the most favourite food?
b. How many children like it?
c. How many children like apples the most?
Answer: We can count each fruit and make this tally chart:
| Fruit | Tally marks | Number of children |
|---|---|---|
| Mango | 9 | |
| Banana | |||| | 4 |
| Apple | 6 | |
| Grapes | 5 |
Using our tally chart, we can answer the questions:
(a) Mango is the most favorite fruit.
(b) There are 9 children who like mangoes.
(c) There are 6 children who like apples the most.
In simple words: This tally table counts the fruits. Mango has the highest count (9). Apple has 6 votes.
Exam Tip: Sum the "Number of children" column to make sure it matches the total number of children given in the question (24).
Question 11. 30 children voted for the monitor of the class. The following results were obtained:
Salma, Anita, Rakesh, Rakesh, Rakesh, Anita, Salma, Anita, Salma, Rakesh, Deepak, Anita, Rakesh, Deepak, Salma, Anita, Deepak, Anita, Rakesh, Anita, Deepak, Salma, Anita, Salma, Anita, Rakesh, Rakesh, Deepak, Salma, Anita
Fill in the table using tally marks.
a. Who was elected as the monitor?
b. How many votes did he/she get?
c. How many more votes did he/she get from his/her nearest rival?
d. Who got the least number of votes? How many?
Answer: We can organize the votes into this tally chart:
| Name | Tally marks | Number of votes |
|---|---|---|
| Deepak | 5 | |
| Anita | 10 | |
| Rakesh | 8 | |
| Salma | 7 |
Using our tally chart, we can answer the questions:
(a) Anita was elected as the class monitor.
(b) She got 10 votes in total.
(c) She got 2 more votes than her nearest rival (Rakesh, who had 8 votes).
(d) Deepak got the least number of votes. He received 5 votes.
In simple words: Anita won the election with 10 votes. Rakesh was close with 8 votes. Deepak had the fewest votes (5).
Exam Tip: Be sure to check every name on your list carefully so you do not make mistakes in your tally count.
Page 165
Summary
1. Data handling means:
- gathering correct information and data.
- writing down the information in a neat way.
- reading and understanding the gathered data.
- learning how to draw pictures, symbols, or tally marks to show our data.
- making tables to display information clearly.
- organizing data in tables using tally marks or pictographs.
- keeping a proper record of all the data we collect.
2. A pictograph is when we use pictures to show our data.
3. Tally marks, also called hash marks, are used for counting. We draw single lines for numbers up to four, and a diagonal line across for the fifth count.
Error Analysis
Students often make mistakes when:
- collecting data.
- counting and doing basic math operations like addition and subtraction.
- organizing large and complicated sets of information.
Page 166
Activity 1: Representing Data on Pictograph
Required Materials: Glue, small bindis, and a sheet of paper.
Step 1: Write down the birth months of all students in your class. The total should equal the number of children in class.
| Month | Jan | Feb | Mar | Apr | May | Jun | Jul | Aug | Sep | Oct | Nov | Dec |
|---|---|---|---|---|---|---|---|---|---|---|---|---|
| Number of students | 8 | 4 | 12 | 10 |
Step 2:
- Choose a title for your pictograph.
- Pick a symbol (like using bindis).
- Choose how many students each symbol stands for.
- Make a table like the one below.
- Stick the correct number of bindis next to each month to show birthdays.
- Find the month with the most birthdays and the month with the least birthdays.
Page 167
Activity 2: Representing Data Using Tally Marks
Show a food picture to about 30 of your classmates.
Find the most popular dish among your classmates. Give small paper slips to everyone and ask them to write down their favorite dish. Fold the slips and place them in a box.
Pick up the first slip. If it says "samosa", draw a single tally mark "|" next to samosa in your table. If the next one is "pizza", draw a tally mark next to pizza. Keep doing this. After four marks, draw the fifth mark across to make a group of 5.
Here is a sample chart. Draw your own chart in your notebook to find the favorite foods of your classmates:
| Dish | Tally mark | Number |
|---|---|---|
| Samosa | ||
| Dhokla | ||
| Pizza | ||
| Dosa | ||
| Rasgulla | ||
| Total | 30 |
Questions to answer:
- Which is the most favorite food?
- Which is the second most favorite food?
Please click on below link to download CBSE Class 3 Maths Data Handling Question Bank
CBSE Mathematics Class 3 Data Handling Worksheet
Students can use the practice questions and answers provided above for Data Handling to prepare for their upcoming school tests. This resource is designed by expert teachers as per the latest 2026 syllabus released by CBSE for Class 3. We suggest that Class 3 students solve these questions daily for a strong foundation in Mathematics.
Data Handling Solutions & NCERT Alignment
Our expert teachers have referred to the latest NCERT book for Class 3 Mathematics to create these exercises. After solving the questions you should compare your answers with our detailed solutions as they have been designed by expert teachers. You will understand the correct way to write answers for the CBSE exams. You can also see above MCQ questions for Mathematics to cover every important topic in the chapter.
Class 3 Exam Preparation Strategy
Regular practice of this Class 3 Mathematics study material helps you to be familiar with the most regularly asked exam topics. If you find any topic in Data Handling difficult then you can refer to our NCERT solutions for Class 3 Mathematics. All revision sheets and printable assignments on studiestoday.com are free and updated to help students get better scores in their school examinations.
FAQs
You can download the latest chapter-wise printable worksheets for Class 3 Mathematics Data Handling for free from StudiesToday.com. These have been made as per the latest CBSE curriculum for this academic year.
Yes, Class 3 Mathematics worksheets for Data Handling focus on activity-based learning and also competency-style questions. This helps students to apply theoretical knowledge to practical scenarios.
Yes, we have provided solved worksheets for Class 3 Mathematics Data Handling to help students verify their answers instantly.
Yes, our Class 3 Mathematics test sheets are mobile-friendly PDFs and can be printed by teachers for classroom.
For Data Handling, regular practice with our worksheets will improve question-handling speed and help students understand all technical terms and diagrams.