

Read and download the CBSE Class 3 Maths Data Handling Worksheet in PDF format. We have provided exhaustive and printable Class 3 Mathematics worksheets for Data Handling, designed by expert teachers. These resources align with the 2026-27 syllabus and examination patterns issued by NCERT, CBSE, and KVS, helping students master all important chapter topics.
Chapter-wise Worksheet for Class 3 Mathematics Data Handling
Students of Class 3 should use this Mathematics practice paper to check their understanding of Data Handling as it includes essential problems and detailed solutions. Regular self-testing with these will help you achieve higher marks in your school tests and final examinations.
Class 3 Mathematics Data Handling Worksheet with Answers
LEARNING OBJECTIVES
This lesson will help you to:—
• collect data from different sources.
• record data using tally marks.
• prepare tables for recording data.
• represent data in terms of pictograph choosing appropriate unit for displaying data.
• represent data in terms of bar charts choosing appropriate scale for displaying data.
• recognize patterns in the data.
• draw conclusions from the data by discussing with teacher.
Real Life Examples
• A pictograph represents data in the form of pictures, objects or parts of objects and helps us to answer questions on the data at a glance.
• Pictographs helps us to represent different types of sales of a store with the help of images, for example, shoe sales, TV sales, phone sales, computer sales, etc.
• A bar graph would allow you to display population of several different countries at one time.
• Data Handling is widely in collection of scores of students in various exams and marking ranks to the students.
ORGANIZATION OF DATA
Once we have some information/data, the next step is to get results from it. This can be done by arranging it.
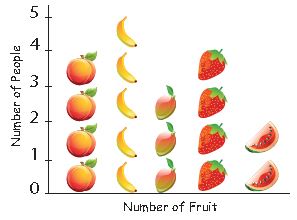
To make sense of the gathered information. It has to be organised and put into tables. We can make tables by using a picture for each. Such an arrangement is called as pictograph.
Example of a pictograph
Number of people with their favourite fruit can be shown using chart as given below:
Number of students with their favorite ice cream can be shown using a bar chart as given below:
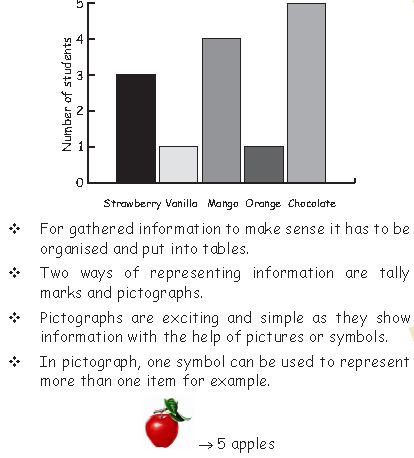
• When the number for each category is quite large, drawing picture is not easy. To solve this problem we draw bars to represent numbers. These bars are called as Tally Marks.
Tally marks are used to represent numbers in the following way
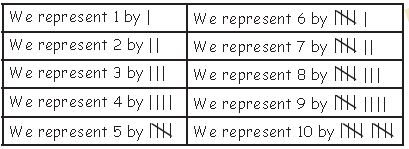
When tally marks are made, the first four marks are made like this ||||. Then the fifth marks is made across the diagonal of four marks ||||. This makes it easy to count the marks
Historical preview
• Pictograph was the earliest form of writing. It was also the first alphabet. Pictograph lasted from about 3000 B.C. to about the 18th century.
• Most ancient people wrote pictograph on stone or clay with a stylus made out of long “reeds or wood, or bone with a narrow, rectangular head.”
• William Playfair invented bar charts in 1786.
DO YOU KNOW
Data handling means to collect and record the information and then present it in the tabular form.
Amazing Facts
• All the following facts are a result of data handling process :
1. Thomas Alva Edison pertented almost 1300 inventions in his life time.
2. It takes 6 months to build a Rolls Royce and 13 hours to build a Toyota.
3. Pictograph sometimes is also called as pictogram
DATA HANDLING PROCESS/CYCLE
1. Specify the problem : Ask a question or questions
2. Plan : Decide what data to collect, who to collect it from and how it will be collected.
3. Process and Representations : Reduce the data to summarize information and represent them using tables, charts, bar graphs, pictographs, etc.
4. Interpret and discuss : Interpret and analyse the tables and charts to draw conclusions.
Misconcept/ Concept
Misconcept : Tally mark to represent 5 is ||||| .
Concept : Tally mark to represent 5 is ||||.
Misconcept : A picture of an object shown in a pictograph represents one object only.
Concept : A picture of an object shown in a pictograph does not always represents one object only.
POINTS TO REMEMBER:-
1. Read the data carefully as the smallest detail may change the meaning of the whole data collected.
For example, if you are collecting data about number of students who like chocolates, ice cream or vanilla ice creams and a student says he does not like vanilla ice cream, then that does not mean he likes chocolate ice cream.
2. Record the data in tabular forms because tables help to understand the data in a better way.
3. Try to understand the data provided carefully before jumping to answer the questions.
4. Relate the data given in table with charts and graphs and draw them to have a better understanding of it.
5. Be very careful of the units used in the tables.
For example, height of students in centimetres or feet.
6. Take care of the scale used in charts and graphs.
For example, 1 picture of cup = 10 cups of tea, etc.
Example: What numbers are being represented by
following tally marks
(a) |||| | (b) |||| ||||
Solution: (a) It represents 5 + 1 = 6
(b) It represents 5 + 5 = 10
Representation of a data
When we represent a data by tally marks or pictograph, then it is easier to understand and analyze the data. We can immediately draw conclusions from such a data. So processing of data is very essential in analyzing it.
Direction (Qs. 1 to 5): Damodar collects wastes from the houses. He collects all kinds of waste thrown in dustbin. He made a list of items that was collected from houses in a locality as given below :
1. How many papers were collected by Damodar ?
(a) 8
(b) 12
(c) 13
(d) 14
Answer : (D) 14 papers were collected by Damodar.
Therefore, answer is option (d) 14.
2. Which item was least in numbers ?
(a) Aluminium Cans
(b) Plastic
(c) Glass
(d) Card-board
Answer : (C) Since, Damodar collected 3 glasses which is least among all.
Therefore, answer is option (c) Glass.
3. How many less card-board were collected than plastic ?
(a) 5
(b) 6
(c) 7
(d) 8
Answer : A
4. Which item was 7 in total ?
(a) Card-board
(b) Aluminium Cans
(c) Plastic
(d) Glass
Answer : (B) 7 aluminium cans were collected.
Therefore, answer is option (b) Aluminium Cans.
5. How many more paper were collected than aluminium cans?
(a) 6
(b) 7
(c) 8
(d) 9
Answer : B
Direction (Qs. 6 to 8): Ice candy house is a shop full of ice candies. The shopkeeper sold many ice candies this week as shown in the table given below. Read the table carefully and answer the questions that follow :
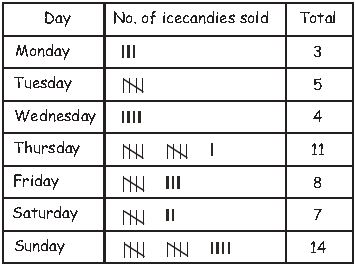
6. If Monday : 3 : : ? : 8 (Mental Mathematics)
(a) Friday
(b) Saturday
(c) Monday
(d) Thursday
Answer : A
7. If Saturday : |||| ||:: Thursday : ? (Mental Mathematics)
(a) |||| ||
(b) |||| |||
(c) |||| |||| |
(d) ||||
Answer : C
8. If |||| : Tuesday : : |||| ||| : ? (Mental Mathematics)
(a) Saturday
(b) Sunday
(c) Tuesday
(d) Friday.
Answer : D
Direction (Qs. 9 to 11): Read the conversation given below and answer the questions that follow :
Teacher : How many times do you brush in a day ?
Pappu : Two times in a day.
Teacher : But you have only one brush in your hand that means
you brush only one time in a day.
Pappu : I forget to bring the second brush.
Teacher : Are you telling the truth ?
9. How many times the word ‘brush’ occurred in the above conversation ?
(a) 2
(b) 3
(c) 4
(d) 5
Answer : (C) The word ‘brush’ occurred 4 times.
Therefore, the answer is option (c) 4.
10. How many times the word ‘day’ occurred in the above conversation ?
(a) 2
(b) 3
(c) 4
(d) 5
Answer : (B) The word ‘day’ occurred 3 times .
Therefore, the answer is option (b) 3.
11. How many times the word ‘you’ occurred in the above conversation ?
(a) 2
(b) 3
(c) 4
(d) 5
Answer : (C) The word ‘you’ occurred 4 times.
Therefore, the answer is option (c) 4.
Direction (Qs. 12 to 16): Mr. Bee collected some flowers to make a bouquet. He made a list of flower is used in the bouquet as given below :
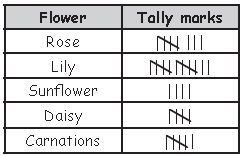
12. How many Daisies he used ?
(a) 4
(b) 5
(c) 6
(d) 7
Answer : B
13. How many Roses he used ?
(a) 6
(b) 7
(c) 8
(d) 9
Answer : C
14. Which flower was used the most times ?
(a) Rose
(b) Sunflower
(c) Lily
(d) Daisy
Answer :
15. Which flower was used 6 times ?
(a) Carnations
(b) Daisy
(c) Rose
(d) Sunflower
Answer : C
16. Which flower was used least times ?
(a) Daisy
(b) Lily
(c) Rose
(d) Sunflower
Answer : D
17. The picture graph below shows the number of pencils that 5 boys have.
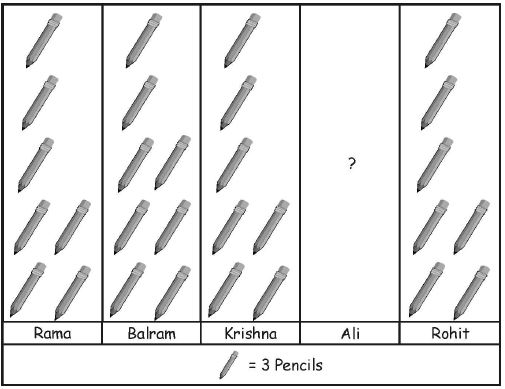
If there are total 120 pencils, then Ali has pencils.
(a) 21
(b) 33
(c) 43
(d) 34
Answer : (B) Ali has = 120 – 3 × 29 = 120 – 87 = 33 pencils.
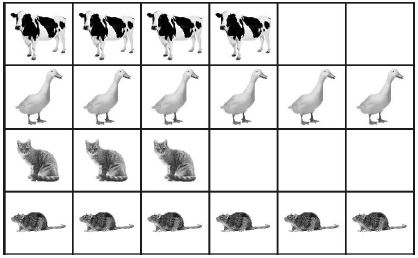
18. Study the following pictograph and find which animal is the least in number?
(a) Cow
(b) Cat
(c) Rat
(d) Duck
Answer : (B) Cat is least in number which is 3.
19.
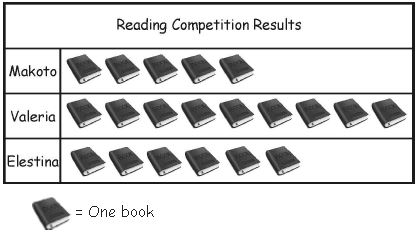
Total number of books read by Makoto and Elestina together is:
(a) 14
(b) 11
(c) 10
(d) 15
Answer : (B) Number of books read by make to and Elestina = 5 + 6 = 11
Directions: (Qs. 20 to 23): Look at the following pictograph and answer the following questions.
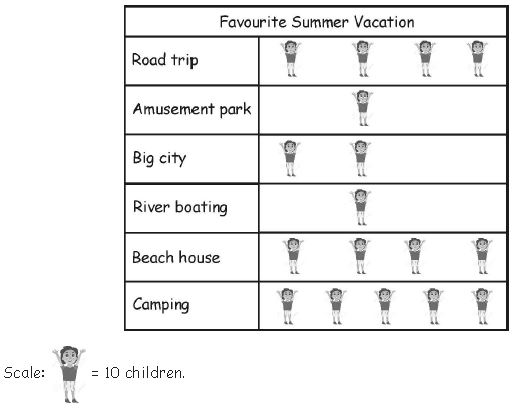
20. How many children choose the beach house vacation?
(a) 20
(b) 10
(c) 40
(d) 90
Answer : (C) Number of children choose the beach house = 4 × 10 = 40
21. Number of children who choose road trip is equal to number of children who choose:
(a) Camping
(b) Beach house
(c) Amusement park
(d) River boating
Answer : B
22. Difference in the number of children who chooose big city and who choose River boating is:
(a) 10
(b) 40
(c) 20
(d) 0
Answer : A
23. Maximum number of children chosen
(a) Beach house
(b) Camping
(c) River boating
(d) Road trip
Answer : B
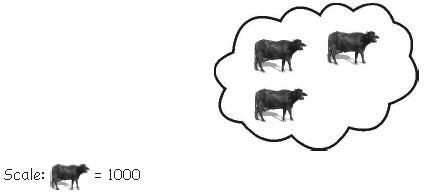
24. What is the total number of buffaloes in the given map?
(a) 1000
(b) 3000
(c) 2000
(d) 6000
Answer : B
25. At a parking, a board shows the following information:
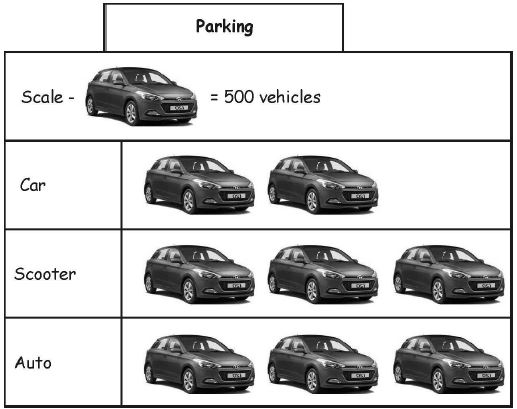
What is the strength of the parking place?
(a) 4000
(b) 5000
(c) 6000
(d) 9000
Answer : A
26. Following are the information which is obtained during the survey. Scale:

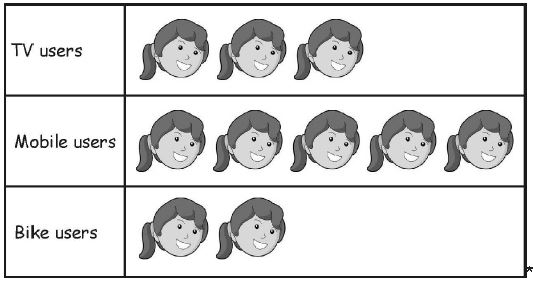
What is the difference between the mobile and bike susers?
(a) 1500
(b) 2500
(c) 1000
(d) 100
Answer : A
27. The information which is printed on the board outside the cinema hall is

= 20 chairs. Sitting arrangement inside the cinema hall is as follows:
Rows Number of chair
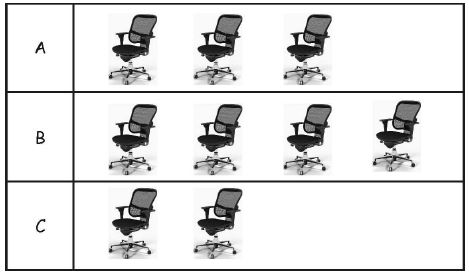
How many chairs are there in the cinema hall?
(a) 170
(b) 220
(c) 180
(d) 185
Answer : C
28. The following figure is the map of a village. If scale is 1 tree = 145 trees, how many trees are there in the village?
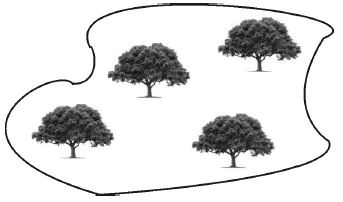
(a) 560
(b) 540
(c) 580
(d) 590
Answer : C
Chapter 11: Data Handling
| Topic Section | Details |
|---|---|
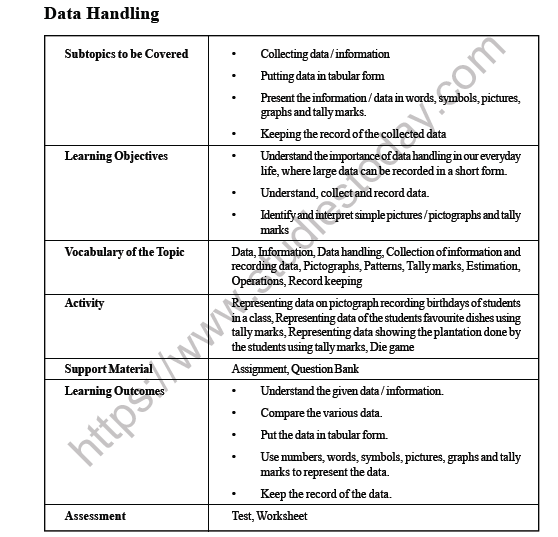
| Subtopics to be Covered | • Gathering facts and information • Making tables to show facts • Showing facts using words, pictures, graphs, and simple marks • Saving the list of facts we gathered |
| Learning Objectives | • Learn why sorting facts helps us in daily life to see big lists in a quick way • Learn how to find, gather, and write down facts • Read and understand simple charts, pictures, and marks |
| Vocabulary of the Topic | Data, Information, Data handling, Collection of information and recording data, Pictographs, Patterns, Tally marks, Estimation, Operations, Record keeping |
| Activity | Representing data on pictograph recording birthdays of students in a class, Representing data of the students favourite dishes using tally marks, Representing data showing the plantation done by the students using tally marks, Die game |
| Support Material | Assignment, Question Bank |
| What You Will Learn | • Understand the given data / information • Compare different groups of facts • Organize facts into clean tables • Show facts using numbers, pictures, and marks • Keep a safe list of your facts |
| Assessment | Test, Worksheet |
Page 153
Introduction
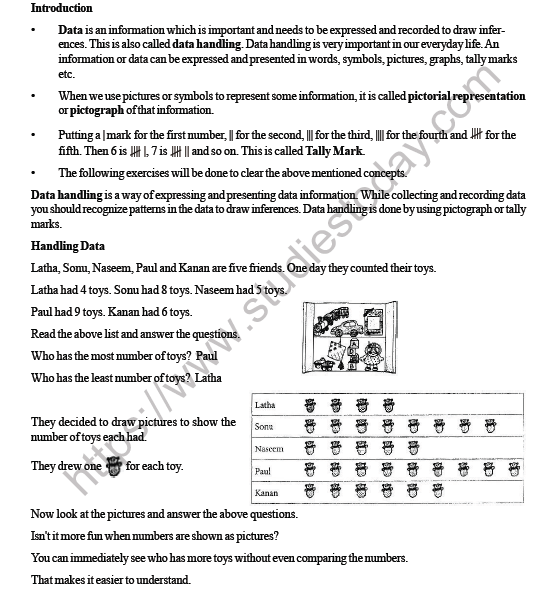
Data is important information. We collect and write down data to understand things better. This is called data handling. We can show data using words, symbols, pictures, graphs, or tally marks.
If we use pictures to show information, we call it a pictograph.
We use straight lines called tally marks to count. We draw single lines up to four: |, ||, |||, ||||. For the fifth count, we draw a line across: ||||. For six, we write |||| |. For seven, we write |||| ||. This is how we count with tally marks.
Handling Data
Latha, Sonu, Naseem, Paul, and Kanan are five friends. One day, they counted how many toys they had:
- Latha had 4 toys.
- Sonu had 8 toys.
- Naseem had 5 toys.
- Paul had 9 toys.
- Kanan had 6 toys.
Question. Who has the most number of toys?
Answer: Paul has the most toys. He has 9 toys in total.
In simple words: Paul has the biggest number of toys.
Exam Tip: Read the list carefully and find the biggest number to find who has the most toys.
Question. Who has the least number of toys?
Answer: Latha has the least toys. She has 4 toys in total.
In simple words: Latha has the smallest number of toys.
Exam Tip: Look for the smallest number in the list to find who has the least toys.
They decided to make a pictograph to show their toys. They drew one toy symbol 🧸 for each toy they owned:
| Friend | Number of Toys |
|---|---|
| Latha | 🧸 🧸 🧸 🧸 |
| Sonu | 🧸 🧸 🧸 🧸 🧸 🧸 🧸 🧸 |
| Naseem | 🧸 🧸 🧸 🧸 🧸 |
| Paul | 🧸 🧸 🧸 🧸 🧸 🧸 🧸 🧸 🧸 |
| Kanan | 🧸 🧸 🧸 🧸 🧸 🧸 |
Page 154
Pictograph
A pictograph is a way to show numbers using pictures. Each picture represents a certain number of things.
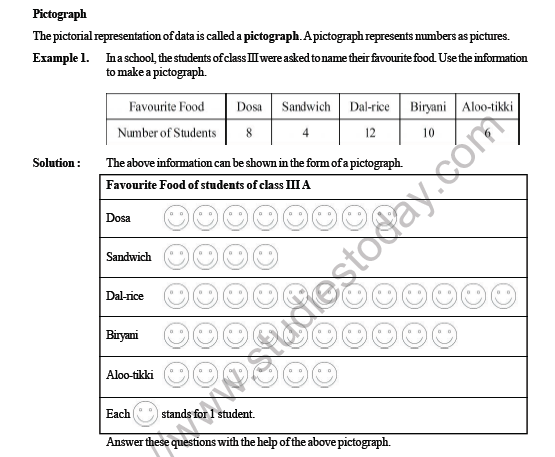
Question. Example 1. In a school, the students of class III were asked to name their favourite food. Use the information to make a pictograph.
| Favourite Food | Dosa | Sandwich | Dal-rice | Biryani | Aloo-tikki |
|---|---|---|---|---|---|
| Number of Students | 8 | 4 | 12 | 10 | 6 |
Answer: We can show this data in a pictograph. Let each smiley face 😊 represent 1 student.
| Favourite Food | Number of Students |
|---|---|
| Dosa | 😊 😊 😊 😊 😊 😊 😊 😊 |
| Sandwich | 😊 😊 😊 😊 |
| Dal-rice | 😊 😊 😊 😊 😊 😊 😊 😊 😊 😊 😊 😊 |
| Biryani | 😊 😊 😊 😊 😊 😊 😊 😊 😊 😊 |
| Aloo-tikki | 😊 😊 😊 😊 😊 😊 |
In simple words: This table uses smiley faces to show how many students like each food. Each smiley means 1 student.
Exam Tip: Make sure you state what one picture stands for at the bottom of your pictograph.
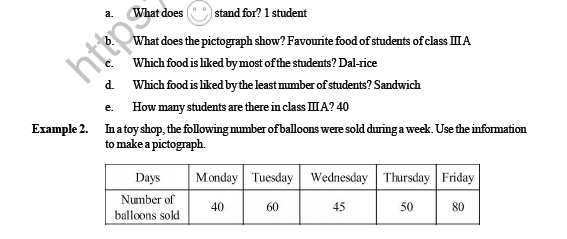
Question. Answer these questions with the help of the above pictograph.
(a) What does 😊 stand for?
(b) What does the pictograph show?
(c) Which food is liked by most of the students?
(d) Which food is liked by the least number of students?
(e) How many students are there in class III A?
Answer:
(a) One smiley 😊 stands for 1 student.
(b) The chart shows the favorite food choices of students in class III A.
(c) Dal-rice is liked by the most students.
(d) Sandwich is liked by the fewest students.
(e) There are 40 students in class III A in total.
In simple words: Look at the pictures to answer. Each face is 1 child. Dal-rice has the most faces, and sandwich has the fewest. There are 40 children in total.
Exam Tip: Add up all the smiley faces in the chart to find the total number of students in the class.
Question. Example 2. In a toy shop, the following number of balloons were sold during a week. Use the information to make a pictograph.
| Days | Monday | Tuesday | Wednesday | Thursday | Friday |
|---|---|---|---|---|---|
| Number of balloons sold | 40 | 60 | 45 | 50 | 80 |
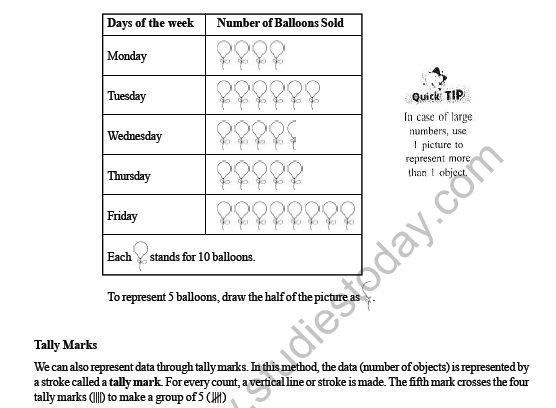
Answer: We can use balloon symbols 🎈 to draw this chart. Since the numbers are large, let each 🎈 represent 10 balloons. A half-balloon shape 🎈(half) will represent 5 balloons.
| Days of the week | Number of Balloons Sold |
|---|---|
| Monday | 🎈 🎈 🎈 🎈 |
| Tuesday | 🎈 🎈 🎈 🎈 🎈 🎈 |
| Wednesday | 🎈 🎈 🎈 🎈 🎈(half) |
| Thursday | 🎈 🎈 🎈 🎈 🎈 |
| Friday | 🎈 🎈 🎈 🎈 🎈 🎈 🎈 🎈 |
In simple words: This chart uses balloon pictures. One balloon stands for 10 real balloons. Half a balloon stands for 5 real balloons.
Exam Tip: If the numbers are big, choose a scale where 1 picture stands for more than 1 object to make drawing easier.
Page 155
Tally Marks
Tally marks are another way to show data. We draw a single straight line called a tally mark for each object we count. After drawing four lines, we cross them with a fifth line to make a group of five.
Question. Example 3. A class of 42 students was asked to name their favourite colour. The following data was collected. Study the tally chart carefully and answer the questions that follow.
| Colours | Tally Marks | Total |
|---|---|---|
| Red | 10 | |
| Yellow | 7 | |
| Blue | 10 | |
| Green | ||| | 3 |
| White | | | 1 |
| Orange | 5 | |
| Pink | 6 |
(a) How many students like blue colour?
(b) Which are the favourite colours of the most number of students?
(c) Which colour is liked by the least number of students?
(d) How many students like pink colour?
(e) How many students like yellow colour?
Answer:
(a) There are 10 students who prefer blue.
(b) The most liked colours are red and blue.
(c) White is liked by the lowest number of students.
(d) Exactly 6 students like pink.
(e) Exactly 7 students like yellow.
In simple words: This chart shows what colours children like. Red and blue are the top favourites. White is the least popular.
Exam Tip: Read the totals at the end of each row to quickly answer the questions.
Page 156
Question. Example 4. The following are the marks obtained by 30 students in a Maths test. Use tally marks to record the data and answer the questions.
25 20 22 25 20 18 19 20 18 20
24 21 19 20 18 21 24 20 19 18
23 20 19 25 24 19 21 20 20 23
(a) How many students obtained the maximum marks?
(b) How many students obtained the minimum marks?
(c) How many students obtained 22 marks?
Answer: We can put this information into a clean tally chart:
| Marks | Tally Marks | Number of students |
|---|---|---|
| 25 | ||| | 3 |
| 24 | ||| | 3 |
| 23 | || | 2 |
| 22 | | | 1 |
| 21 | ||| | 3 |
| 20 | 9 | |
| 19 | 5 | |
| 18 | |||| | 4 |
Using our table, we can answer the questions:
(a) There are 3 students who got the highest marks of 25.
(b) We can see that 4 students got the lowest score of 18.
(c) Only 1 student scored exactly 22 marks on the test.
In simple words: Look at the table to find the answers. The top mark is 25, and the bottom mark is 18.
Exam Tip: Find the largest score on the list to identify the maximum marks, and count how many students received that score.
Question. Example 5. The following are the games played by 25 children. Use tally marks to record the data.
cricket, badminton, tennis, tennis, football
cricket, cricket, football, tennis, badminton
badminton, tennis, cricket, football, football
cricket, tennis, badminton, cricket, cricket
football, cricket, badminton, football, tennis
Answer: We can count each game and show them using tally marks in this table:
| Game | Tally Marks | Number of Children |
|---|---|---|
| Cricket | 8 | |
| Football | 6 | |
| Tennis | 6 | |
| Badminton | 5 |
In simple words: This table groups the sports by counting them. Cricket is the game played by the most children.
Exam Tip: Cross off each sport on your sheet as you add its tally mark to make sure you do not miss any.
Page 157
Question. Example 6. Tina, Mina, Anil and Sunil got money from their parents to spend in the school festival. Draw a pictograph to show the money each got.
Tina Rs. 10, Mina Rs. 5, Anil Rs. 6, Sunil Rs. 8
Answer: Let each coin symbol 🪙 represent 1 rupee.
| Name | Money Received |
|---|---|
| Tina | 🪙 🪙 🪙 🪙 🪙 🪙 🪙 🪙 🪙 🪙 |
| Mina | 🪙 🪙 🪙 🪙 🪙 |
| Anil | 🪙 🪙 🪙 🪙 🪙 🪙 |
| Sunil | 🪙 🪙 🪙 🪙 🪙 🪙 🪙 🪙 |
In simple words: Each coin picture means Rs. 1. Tina has the most coin pictures.
Exam Tip: Keep your picture symbols of equal size and evenly spaced so they are easy to compare.
Question. Example 7. Represent the number of children in each section of Class 3 in a pictograph.
Class 3A: 45, Class 3B: 40, Class 3C: 50, Class 3D: 35
Answer: It is hard to draw so many small figures. Instead of drawing one symbol for every single child, let us make one standing figure 🧍 represent 10 children.
To show 5 children, we will draw only half of the figure: 🧍(half).
| Class Section | Number of Children |
|---|---|
| Class 3A | 🧍 🧍 🧍 🧍 🧍(half) |
| Class 3B | 🧍 🧍 🧍 🧍 |
| Class 3C | 🧍 🧍 🧍 🧍 🧍 |
| Class 3D | 🧍 🧍 🧍 🧍(half) |
In simple words: One standing figure means 10 children. Half a figure means 5 children. Class 3C has the most children.
Exam Tip: Always make sure to write a clear key showing what a full and half symbol stand for.
Please click on below link to download CBSE Class 3 Maths Data Handling Worksheet
CBSE Mathematics Class 3 Data Handling Worksheet
Students can use the practice questions and answers provided above for Data Handling to prepare for their upcoming school tests. This resource is designed by expert teachers as per the latest 2026 syllabus released by CBSE for Class 3. We suggest that Class 3 students solve these questions daily for a strong foundation in Mathematics.
Data Handling Solutions & NCERT Alignment
Our expert teachers have referred to the latest NCERT book for Class 3 Mathematics to create these exercises. After solving the questions you should compare your answers with our detailed solutions as they have been designed by expert teachers. You will understand the correct way to write answers for the CBSE exams. You can also see above MCQ questions for Mathematics to cover every important topic in the chapter.
Class 3 Exam Preparation Strategy
Regular practice of this Class 3 Mathematics study material helps you to be familiar with the most regularly asked exam topics. If you find any topic in Data Handling difficult then you can refer to our NCERT solutions for Class 3 Mathematics. All revision sheets and printable assignments on studiestoday.com are free and updated to help students get better scores in their school examinations.
FAQs
You can download the latest chapter-wise printable worksheets for Class 3 Mathematics Data Handling for free from StudiesToday.com. These have been made as per the latest CBSE curriculum for this academic year.
Yes, Class 3 Mathematics worksheets for Data Handling focus on activity-based learning and also competency-style questions. This helps students to apply theoretical knowledge to practical scenarios.
Yes, we have provided solved worksheets for Class 3 Mathematics Data Handling to help students verify their answers instantly.
Yes, our Class 3 Mathematics test sheets are mobile-friendly PDFs and can be printed by teachers for classroom.
For Data Handling, regular practice with our worksheets will improve question-handling speed and help students understand all technical terms and diagrams.